
Regular economic development patterns with seismic implications
Global economic development has progressed with several highly regular patterns for more than half a century. These patterns may change, but their implications deserve much more attention and respect.

At small-to-medium space and time scales, economic forecasting can seem difficult. Will there be a recession this year? Will the Fed lower or raise interest rates? Will the AI bubble burst? Will the gold and silver boom continue? I don’t know, and you probably don’t either.
At large space and time scales, though, economic development has followed some highly regular patterns for over half a century. These patterns have major, underappreciated implications for a whole bunch of issues of public concern related to our economies, inequality, democracy, geopolitics, debates about trade, population growth, and climate change (to name a few) that we don’t think about enough.
I am not arguing that these economic development patterns can’t or won’t ever change. But, in some areas, as I show below, major institutions are barely even considering what happens if they stay the same.
Regular economic development patterns
GDP per capita growth has followed a very stable, humped-shape pattern across GDP per capita levels since the 1960s at least, as my colleagues and I described in this 2023 paper. The pattern has some heterogeneity at the level of countries (especially small ones), but it is strikingly clear when one aggregates to income groups of countries.
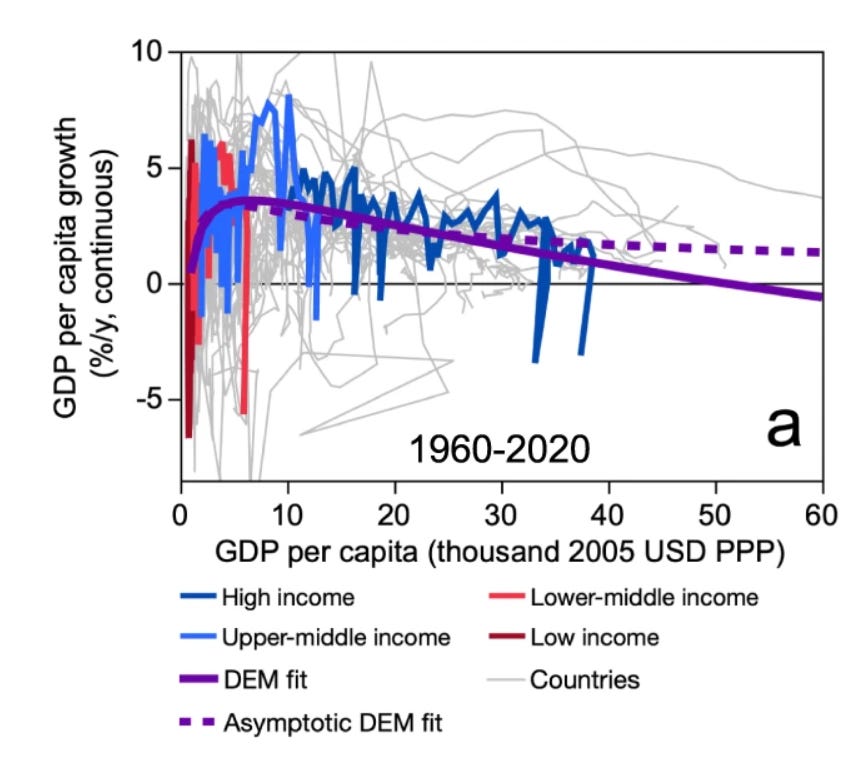
The reasons for this pattern are well-known by economists. Here’s how we summarize them in our paper:
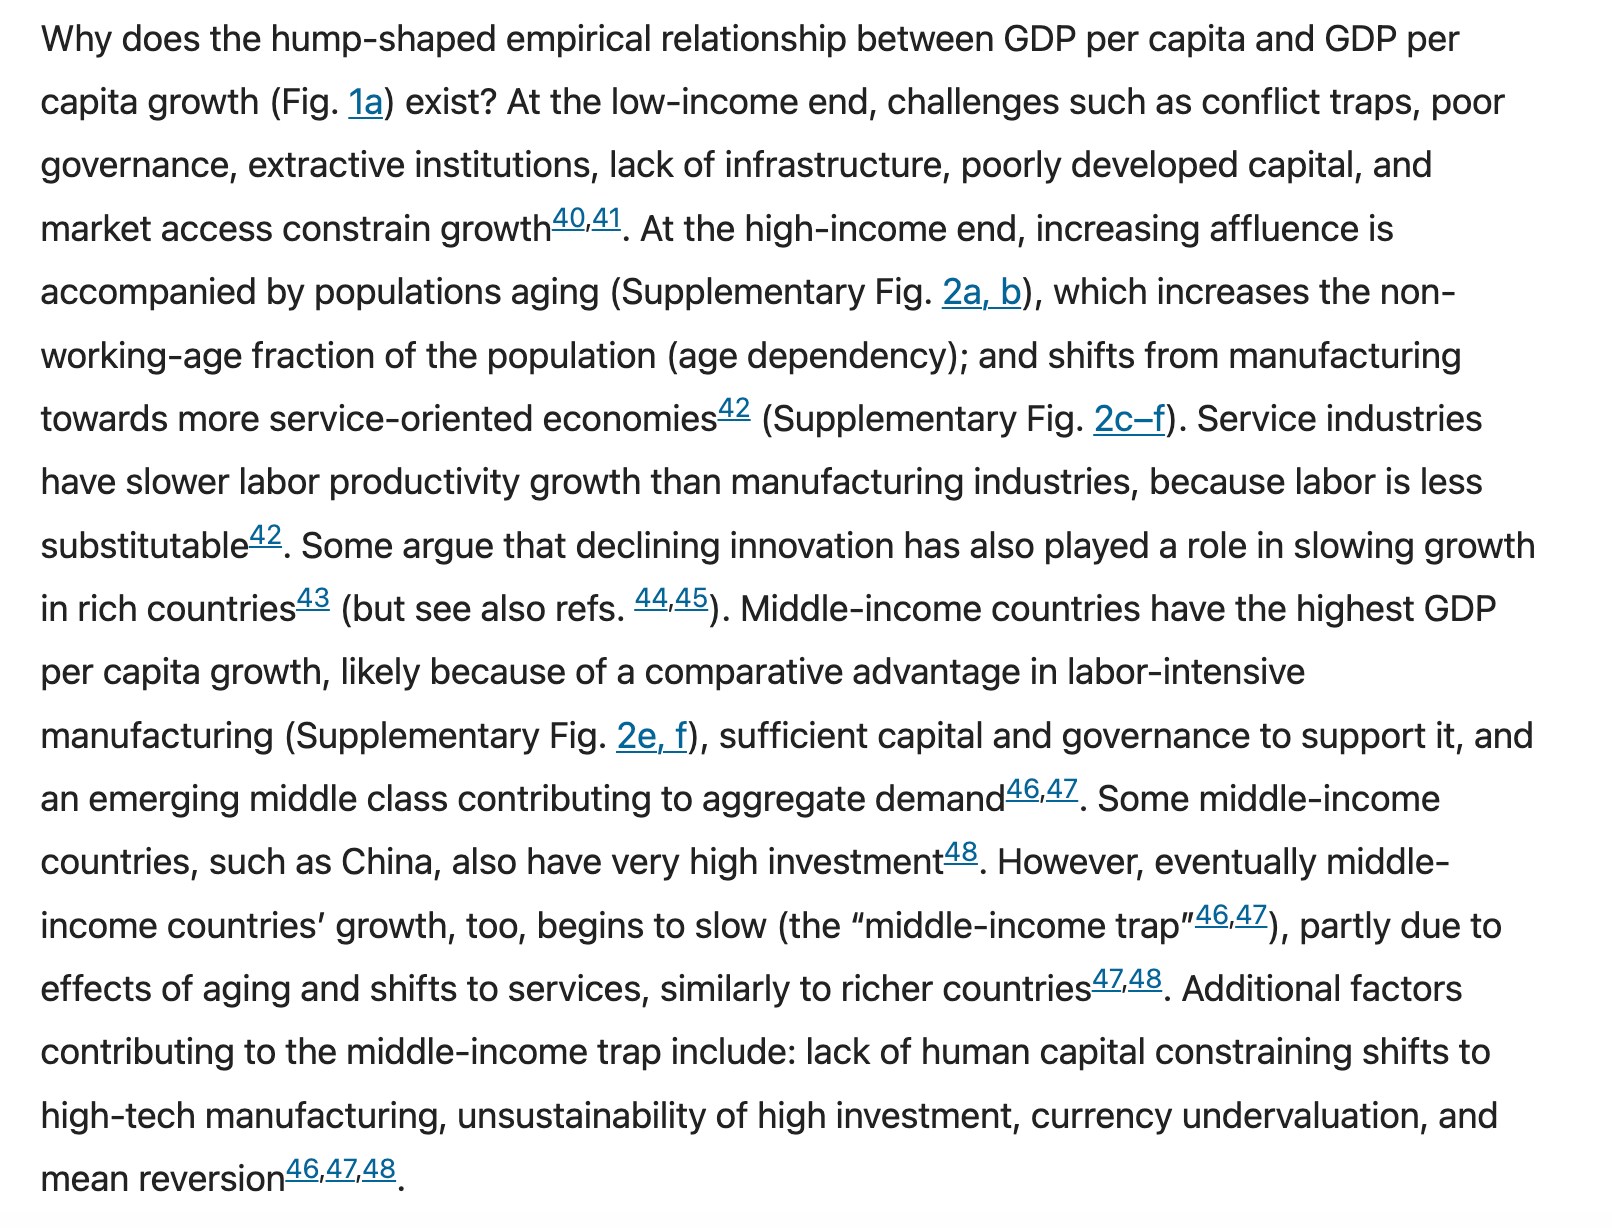
In other words, very poor countries tend to have too little capital (including human capital) and consumer spending power, too much uncertainty and instability, and too-unattractive investment climates, to power high economic growth rates. Very rich countries have slow growth because of their aging populations and service-oriented economies. Middle-income countries grow the fastest because they are rich enough to have manufacturing capital and an emerging middle class, and poor enough to still have cheap labor and lots of room to improve their productivity. The graphs below show how fertility rates, and employment in industry and services—key drivers of this pattern—vary with GDP per capita.
To illustrate just how stable these development patterns have been, we showed in our paper that you could have fit a simple, three-parameter model to the GDP per capita data above, in the 1980s (i.e. not using any data newer than that), and you would have done a substantially better job forecasting income-group GDP per capita growth in the 2000s and 2010s than the International Monetary Fund (IMF)’s short-term forecasts from the 2000s and 2010s. (We called our simple model a differential-equation model, or DEM, for short.)

What happens if these development patterns persist?
If the development patterns described above continue to hold in the future, here is a short (non-exhaustive) list of major implications, some of which are still on the fringes of the discourse in research, policy and the public square.
“Worst-case” long-run economic outlooks—with respect to growth and inequality—might actually be best-case outlooks.
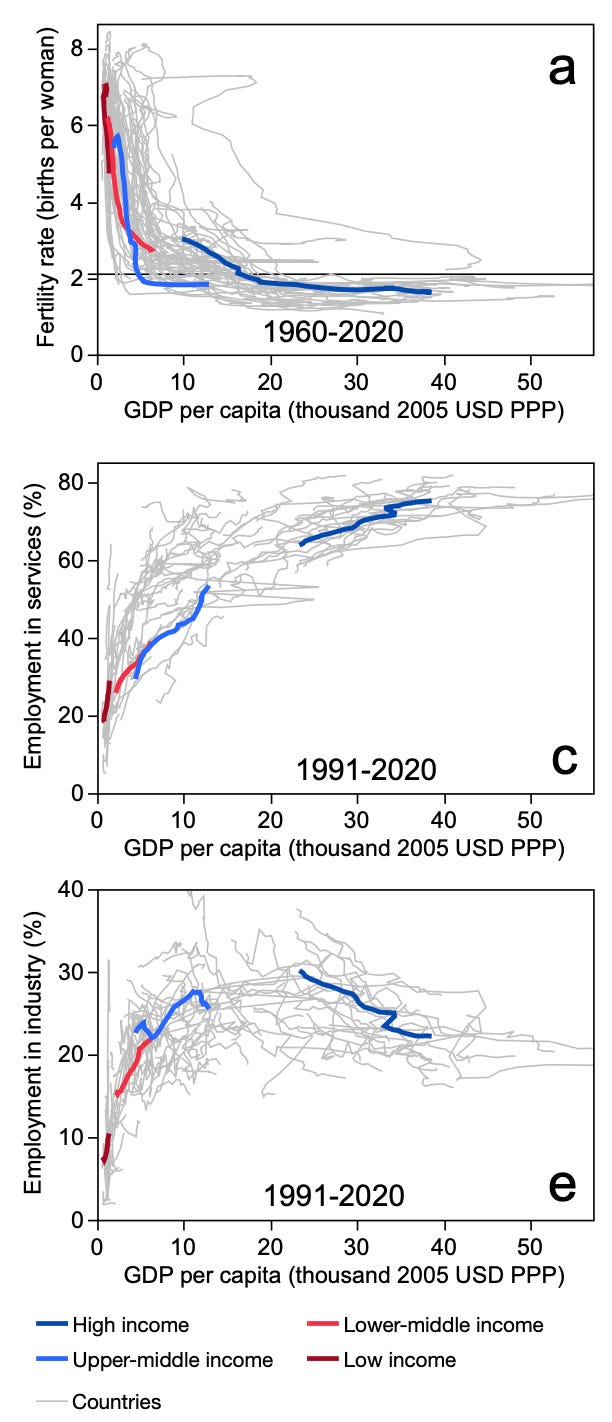
The graph below compares economic outlooks following historical development trends (our DEM, in purple, and a much more complicated model, called International Futures, or IFs, from our colleagues at the University of Denver, in pink) to outlooks from Shared Socioeconomic Pathway (SSP) scenarios used in climate change research, which roughly span the range of major expert and agency macroeconomic forecasts to 2100.
Our DEM and IFs models disagree with each other on the outlook for the high-income group (both models have growth slowing compared to today, but IFs is relatively more optimistic, in line with mid-range SSP scenarios). For the other groups (low- and middle-income), our models are both in line with the worst-case SSP scenarios. However, the graph above shows that our models would have been too optimistic in the past when forecasting GDP per capita growth in low-income countries. If that bias continues forward, then the economic outlook for today’s low-income countries could be worse than all SSP scenarios and major agency outlooks.

In other words, many of our major agencies (including the Intergovernmental Panel on Climate Change, IPCC) may not even be considering the most likely scenarios for future economic development.
To give some more concrete perspective: average GDP per capita in the Middle East and Africa is roughly $5,000 (in 2005 USD) today, and in 2100 it reaches ~$120,000 in SSP5 (the fastest-growth SSP scenario), ~$50,000 in SSP2 (“middle of the road”, according to the SSPs), and ~$15,000 in SSP3 and SSP4 (the slow-growth scenarios). So, major development agencies are imagining a middle-of-the-road world in 2100 where today’s poor regions are roughly ten times as rich as they are today, similarly rich as today’s rich countries are today. They should probably be planning more seriously for worlds where today’s poor regions are much poorer than that (though still probably richer than they are today). They should probably also prepare for a world in 2100 with higher global income inequality than exists today, and all of the challenges that brings, including, for example, increased migration flows.
To get the world economy back to the “middle-of-the-road” SSP2 scenario, we wouldn’t just have to depart dramatically from the past half-century’s development trends described above (see panel a in the graph immediately above), we would have to do so almost immediately, because of how economic growth compounds over time. For example, we showed that the world would need to double current GDP per capita growth rates (compared to their levels, in line with SSP5) by 2030 to make SSP2’s 2100 GDP per capita projections achievable (see the graphs below and above). The later the development trends change, the less different their outcomes can look in 2100 from the continuation of past trends (see below).
The U.S. would have to become very poor to bring back its manufacturing golden age and rival China’s manufacturing dominance.
Last April—as the debate surrounding President Trump’s global tariff policies was heating up—The Economist plotted industry employment as a share of total employment for several major countries, going back to 1801, illustrating the pattern I highlighted above.
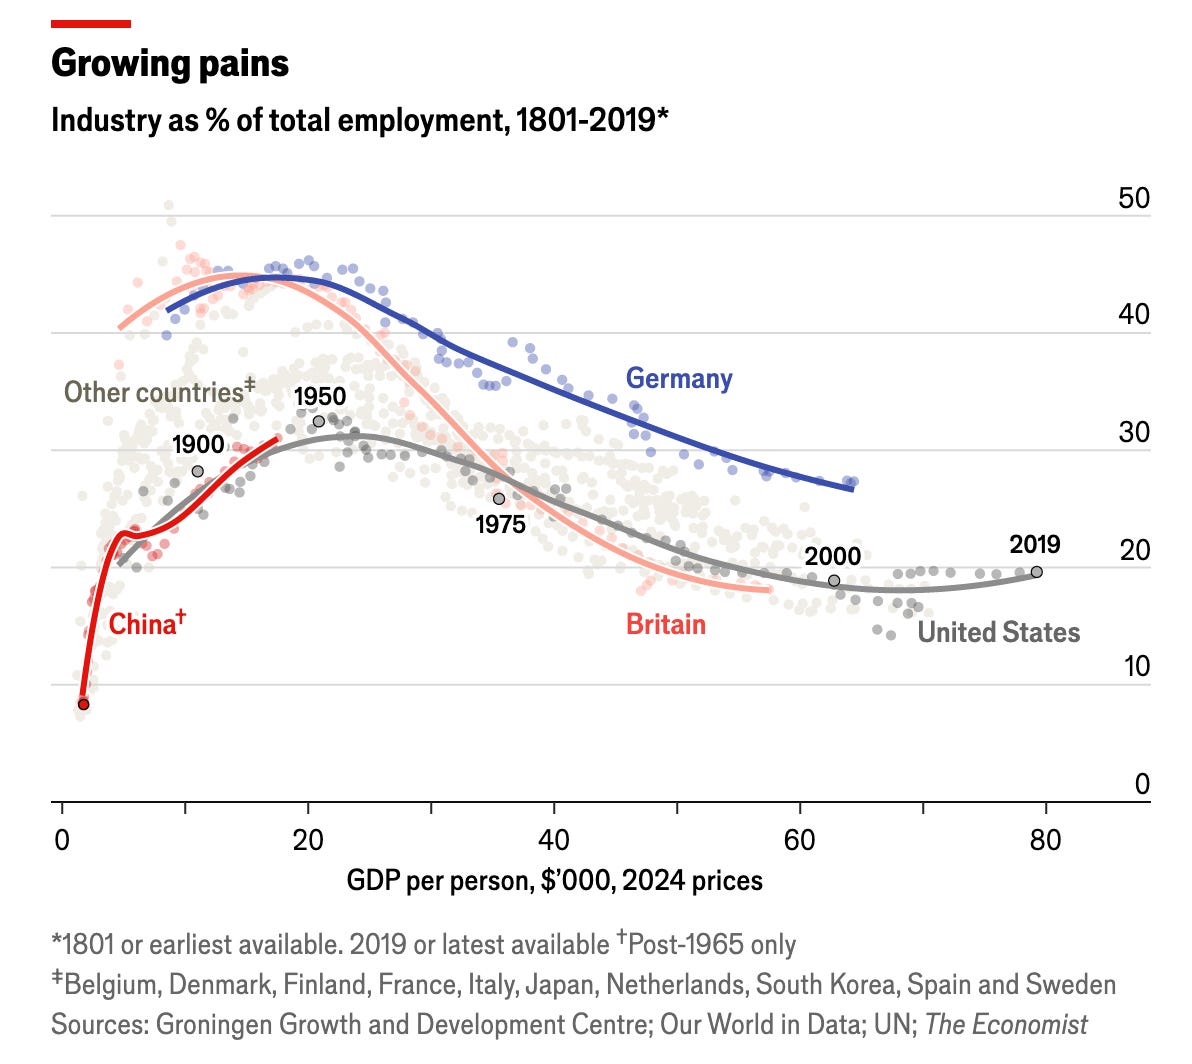
If this pattern continues to hold, it suggests that economies reach their manufacturing peaks (compared to the total economy) at roughly one-fourth the level of affluence that the United States has today.
Many arguments for U.S. protectionism have narrower goals than restoring peak manufacturing—wanting to protect key strategic industries like steel, for example. However, I have also heard some conservatives—especially young conservatives—articulate a desire to use protectionism to take America back to its manufacturing golden age. And, to their credit, when I press them in private on the tradeoffs, I often find that they are logically consistent enough to admit willingness to pursue protectionism even if it makes the country as a whole poorer, because it would (in their view) revive communities in places like the rust belt that have been left behind over the past two decades. But are they willing to make the country 75% poorer, if that’s what it would take to bring back the so-called golden age? I suspect not.
(Of course, there are also other practical challenges to the protectionist project. For example, global supply-chain integration means that U.S. tariffs hurt U.S. manufacturers through their input costs. Partly for this reason, manufacturing employment has decreased over the past year, as I mentioned in a previous post.)
Human population growth will be slower (and declines will be faster) than most people think.
On this topic, I highly recommend following the work of Jesús Fernández-Villaverde, the world’s leading thinker on global population economics, in my estimation. He has shown how the United Nations (UN) projects population growth forward assuming that rapid, global declining fertility trends will suddenly stabilize or reverse. However, even if the declining fertility trends did reverse, but they first persisted for a few years to decades, global population in 2100 could be 1-2 billion less than the UN’s current baseline (medium) projection (see the graph below, from The Economist, based on Fernández-Villaverde’s work).
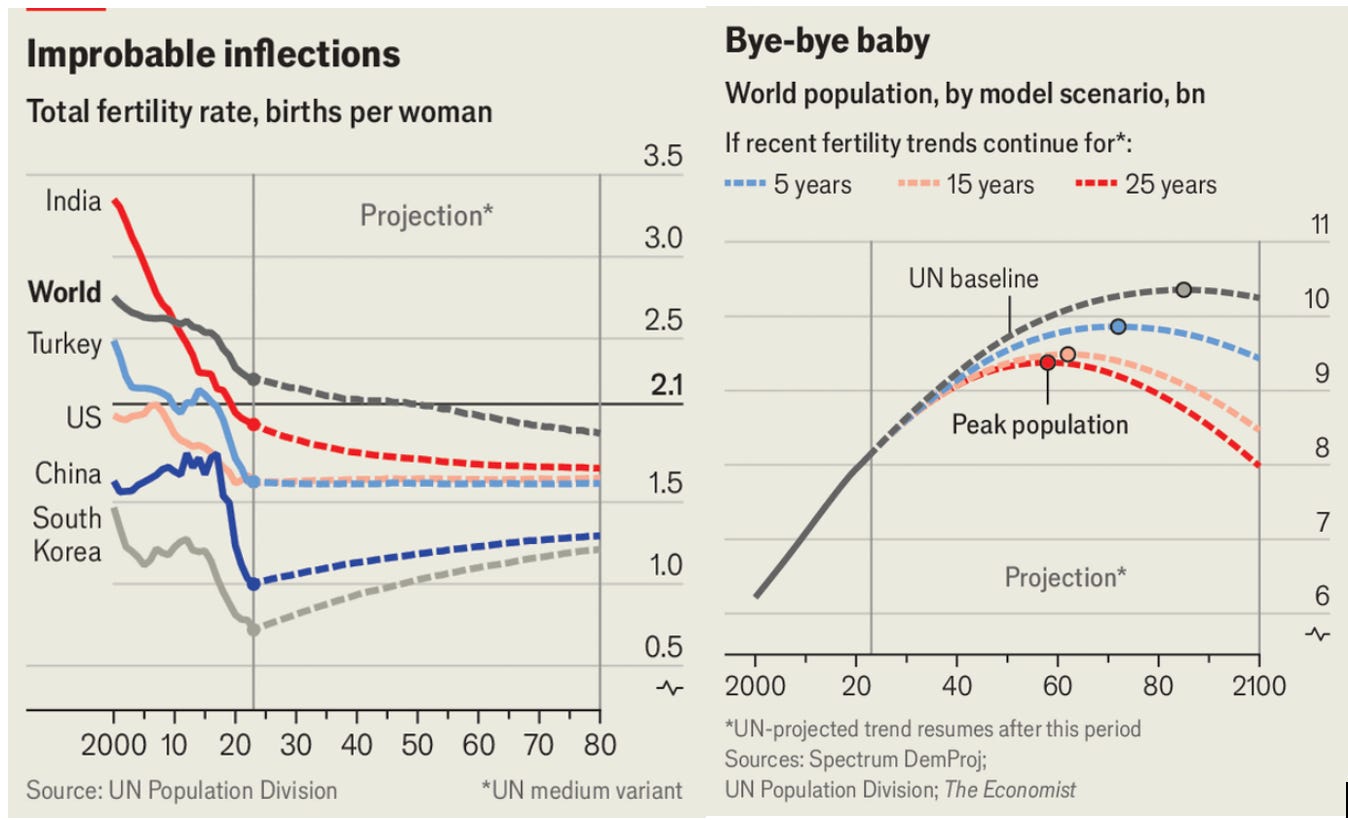
In other words, similarly to the GDP per capita growth trends I described above, past trends in fertility would need to change substantially and immediately for the long-run population outlook to not be substantially lower than the UN currently expects.
Some of the declining fertility trends are more recent than the 1960s, so the population story is not entirely related to the economic story described above. However, as Fernández-Villaverde and others have discussed, economic and population trends strongly affect each other. So, slower-than-expected GDP per capita growth and slower-than-expected population growth could feed off of each other, especially if the economic stresses of aging populations continue to fall disproportionately on young adults. John Burn-Murdoch and Russ Greene discussed this reality in recent viral articles.
We know more about who the major world powers will be in 2100 than we think.
Discussions of 21st-century geopolitics sometimes muse about the fall of U.S. dominance, the rise of China, or even the rise of other countries, like India and Nigeria. Indeed, if we consider the full range of economic and population forecasts considered plausible by the UN, IPCC, and other major agencies, it is possible to get all kinds of 2100 geopolitical scenarios. For example, in a 2024 paper, Jonathan Moyer sketched out “capabilities” (measured by GDP x GDP per capita, which roughly approximates geopolitical power) in different SSP scenarios, finding that Nigeria and India become dominant superpowers by 2100 in scenarios with fast economic growth like SSP5 (see below).
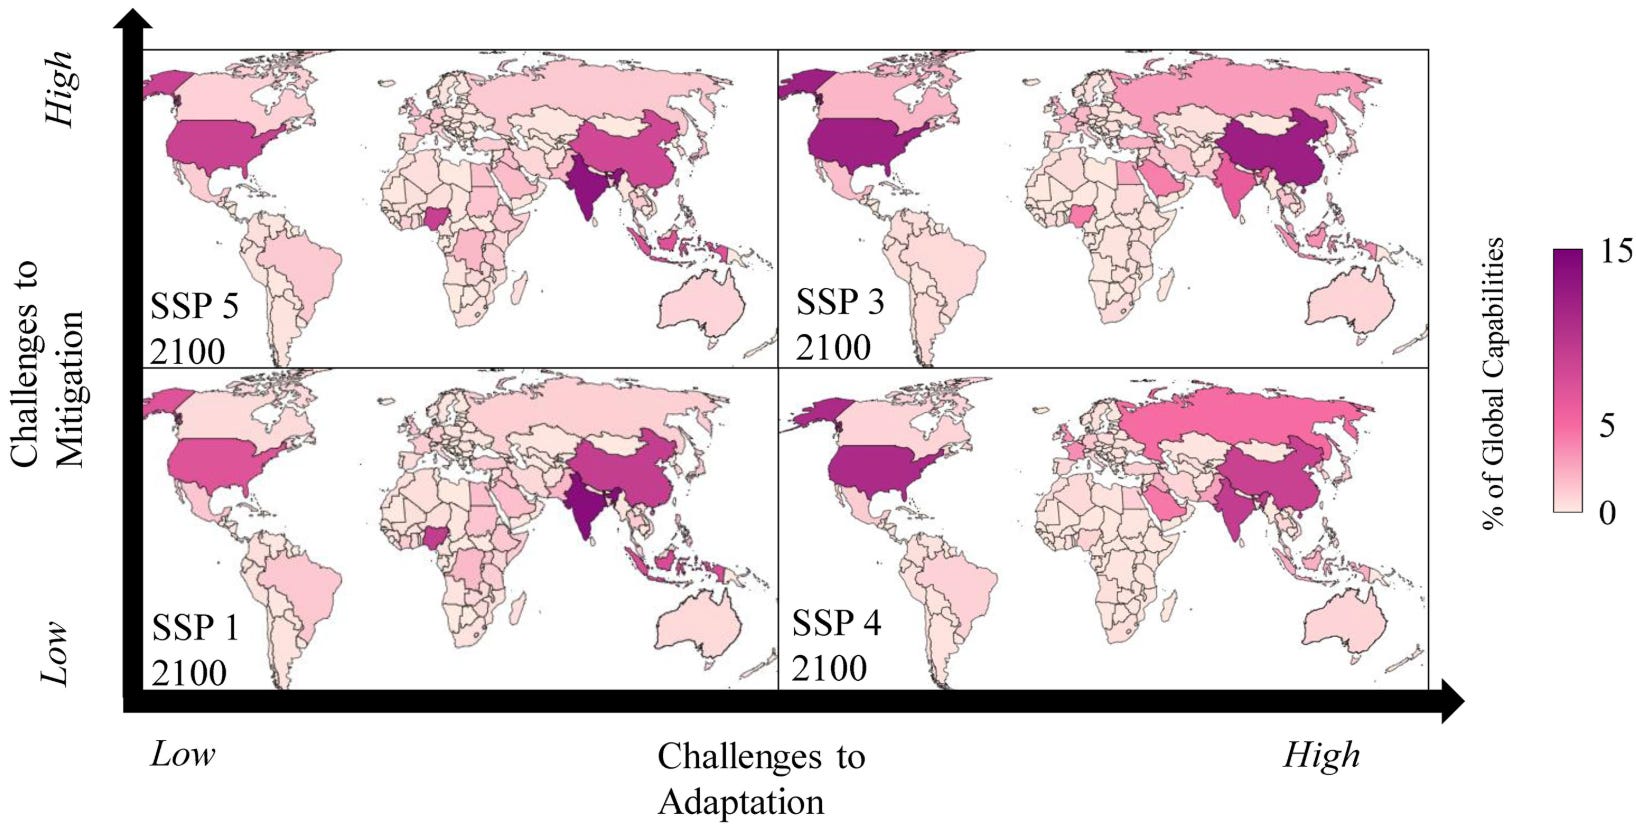
However, if we consider my argument above that slow-growth scenarios like SSP3 and SSP4 (or worse) are much more plausible, we see U.S.-China geopolitical dominance as much more likely to persist. In fact, slower-than-expected population growth might even stall the rise of China. Current fertility trends project China losing more than half of its current population this century.
In other words, if you think that we will see the U.S. lose its global geopolitical dominance this century, you might be surprised. If you expect to see India and Nigeria become dominant players this century, you will almost certainly be surprised.
Democracies will need to adapt to uncharted slow-growth conditions.
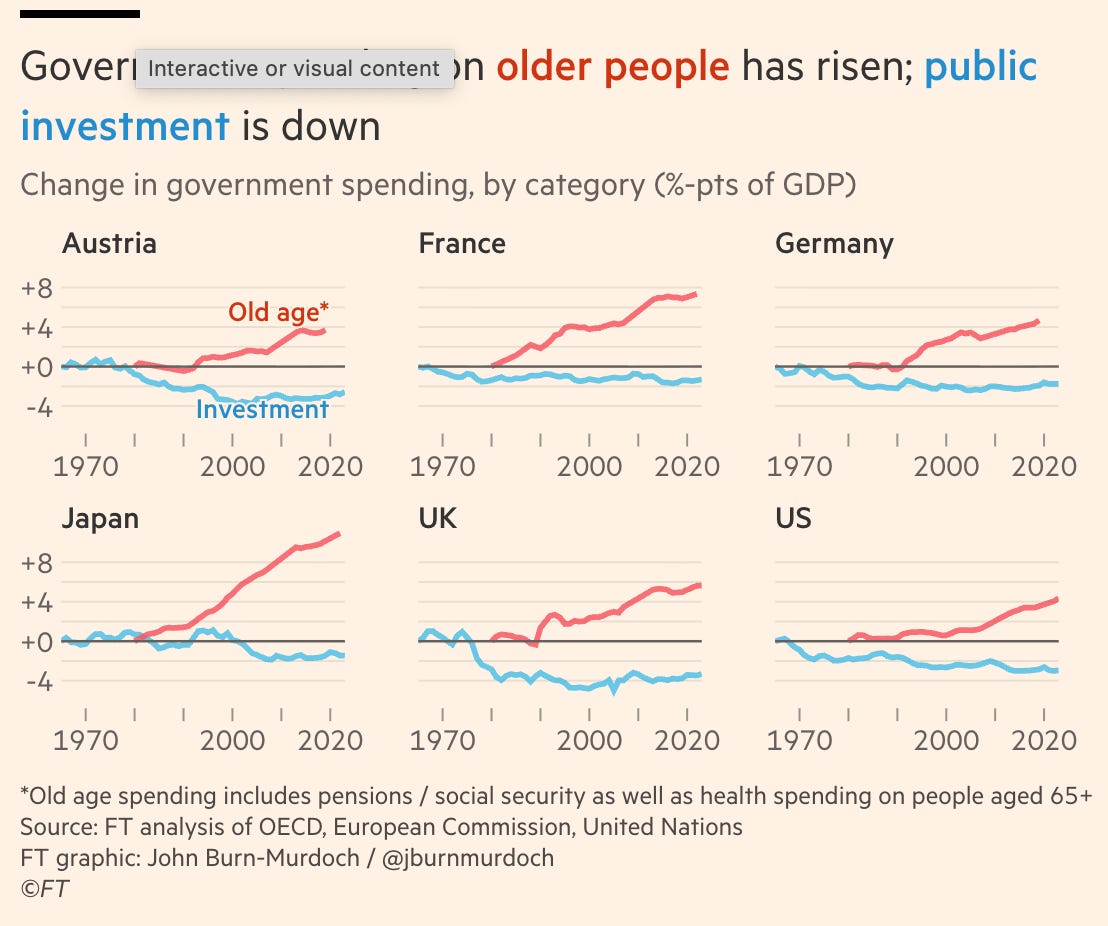
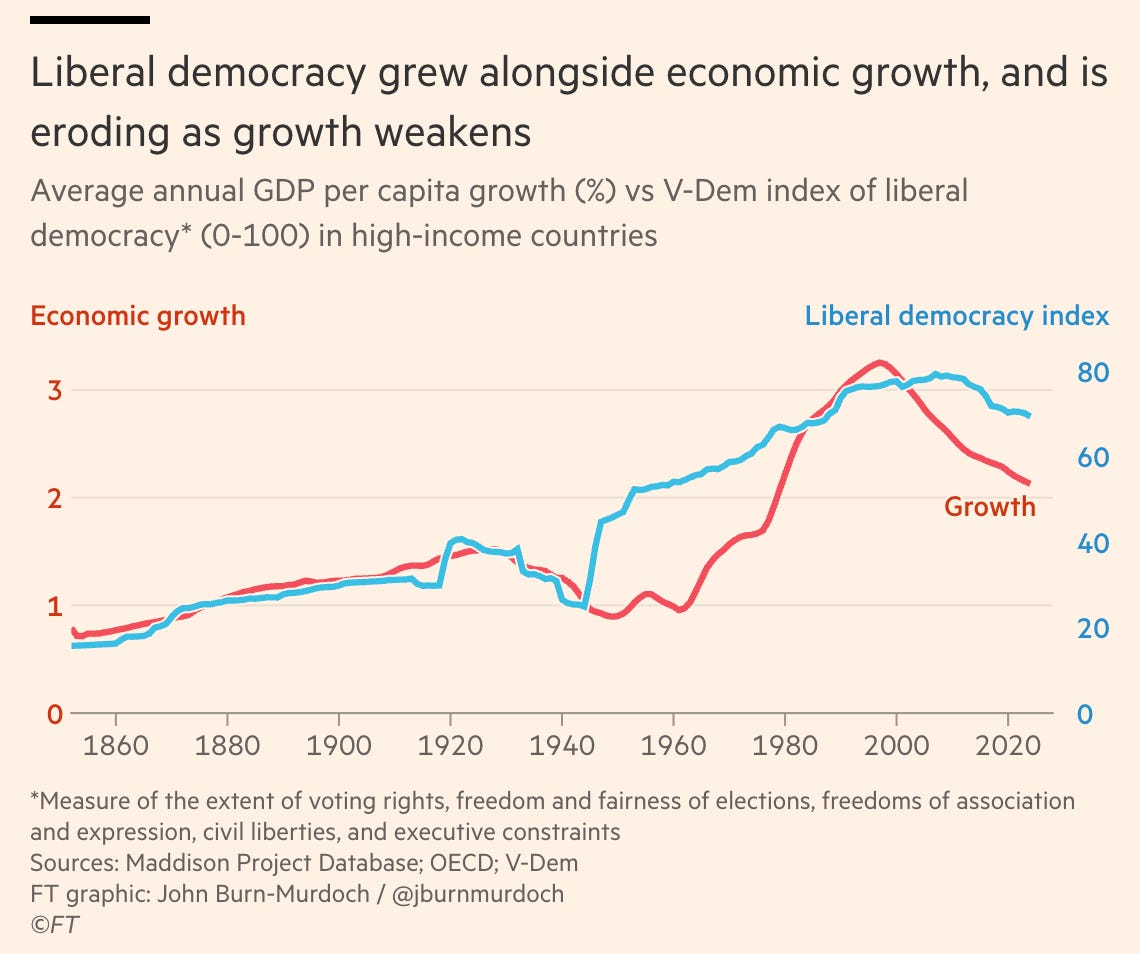
As my colleagues and I showed in a 2021 paper, the rise of global democracy closely tracked the rise of global GDP per capita growth since the 1800s (see below). As growth has slowed over the past several decades in rich countries, democracy has broadly come under strain. John Burn-Murdoch discussed this challenge in his viral article this past week.
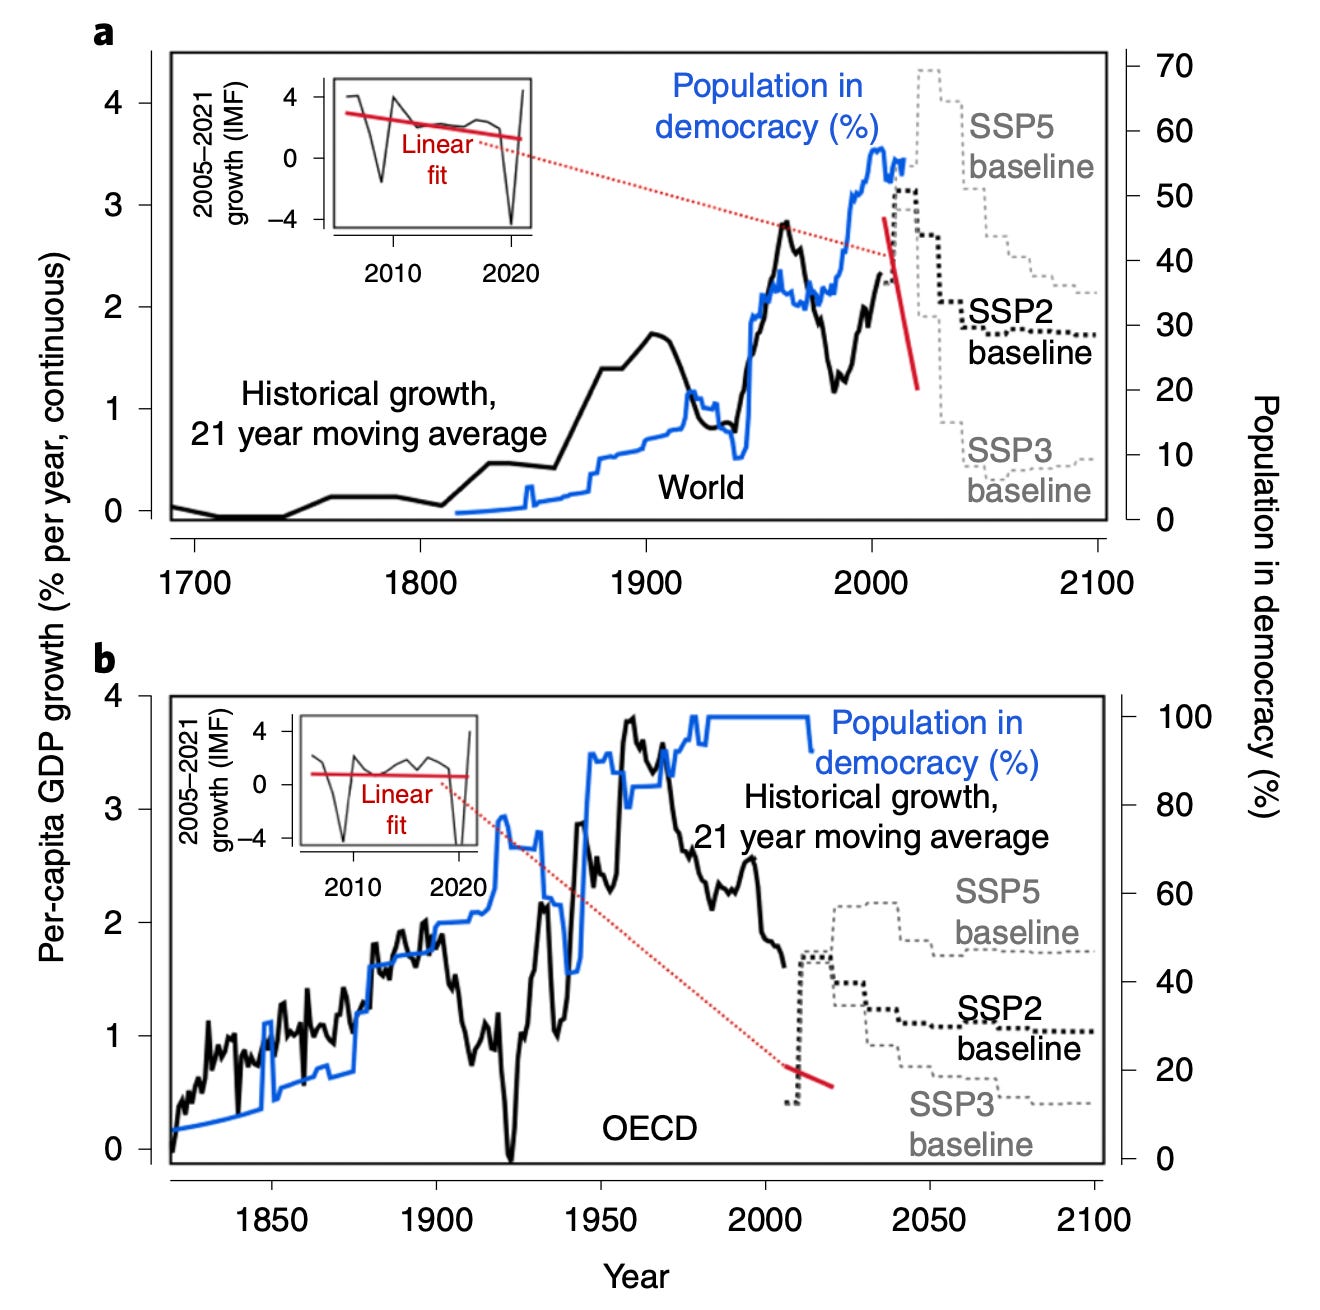
As the graphs above show, all but the most optimistic economic outlooks for rich countries have per-capita growth continuing to gradually slow in the coming decades due to aging, shifts to services, and other long-standing trends. Permanent disruptions to global trade and geopolitical stability, and/or worsening fertility declines, could further slow growth.
Slow and slowing per-capita economic growth poses a number of major fiscal and social challenges to democracies, as my colleagues and I review in our paper, and Burn-Murdoch discusses, too. Among other things, it strains public finances, makes our society more seemingly zero-sum and competitive, and creates gaps between young people’s expectations and reality that can fuel unrest and populism.
It’s possible that artificial intelligence (AI) could buffer economic growth against these historical trends of secular stagnation. However, many economists, such as Tyler Cowen and Daron Acemoglu, do not expect AI to make a big enough difference to deviate qualitatively from historic trends in the medium term. Even if AI did save our economies from secular stagnation, it would likely bring other problems with it, like mass automation of jobs and increases in inequality.
There will be less climate change than people think, but adaptation to it may be harder.
It is sometimes helpful to decompose greenhouse gas (GHG) emissions (which cause climate change) according to the IPAT equation (impact = population x affluence x technology):
GHG emissions = population x GDP per capita x GHG emissions/GDP
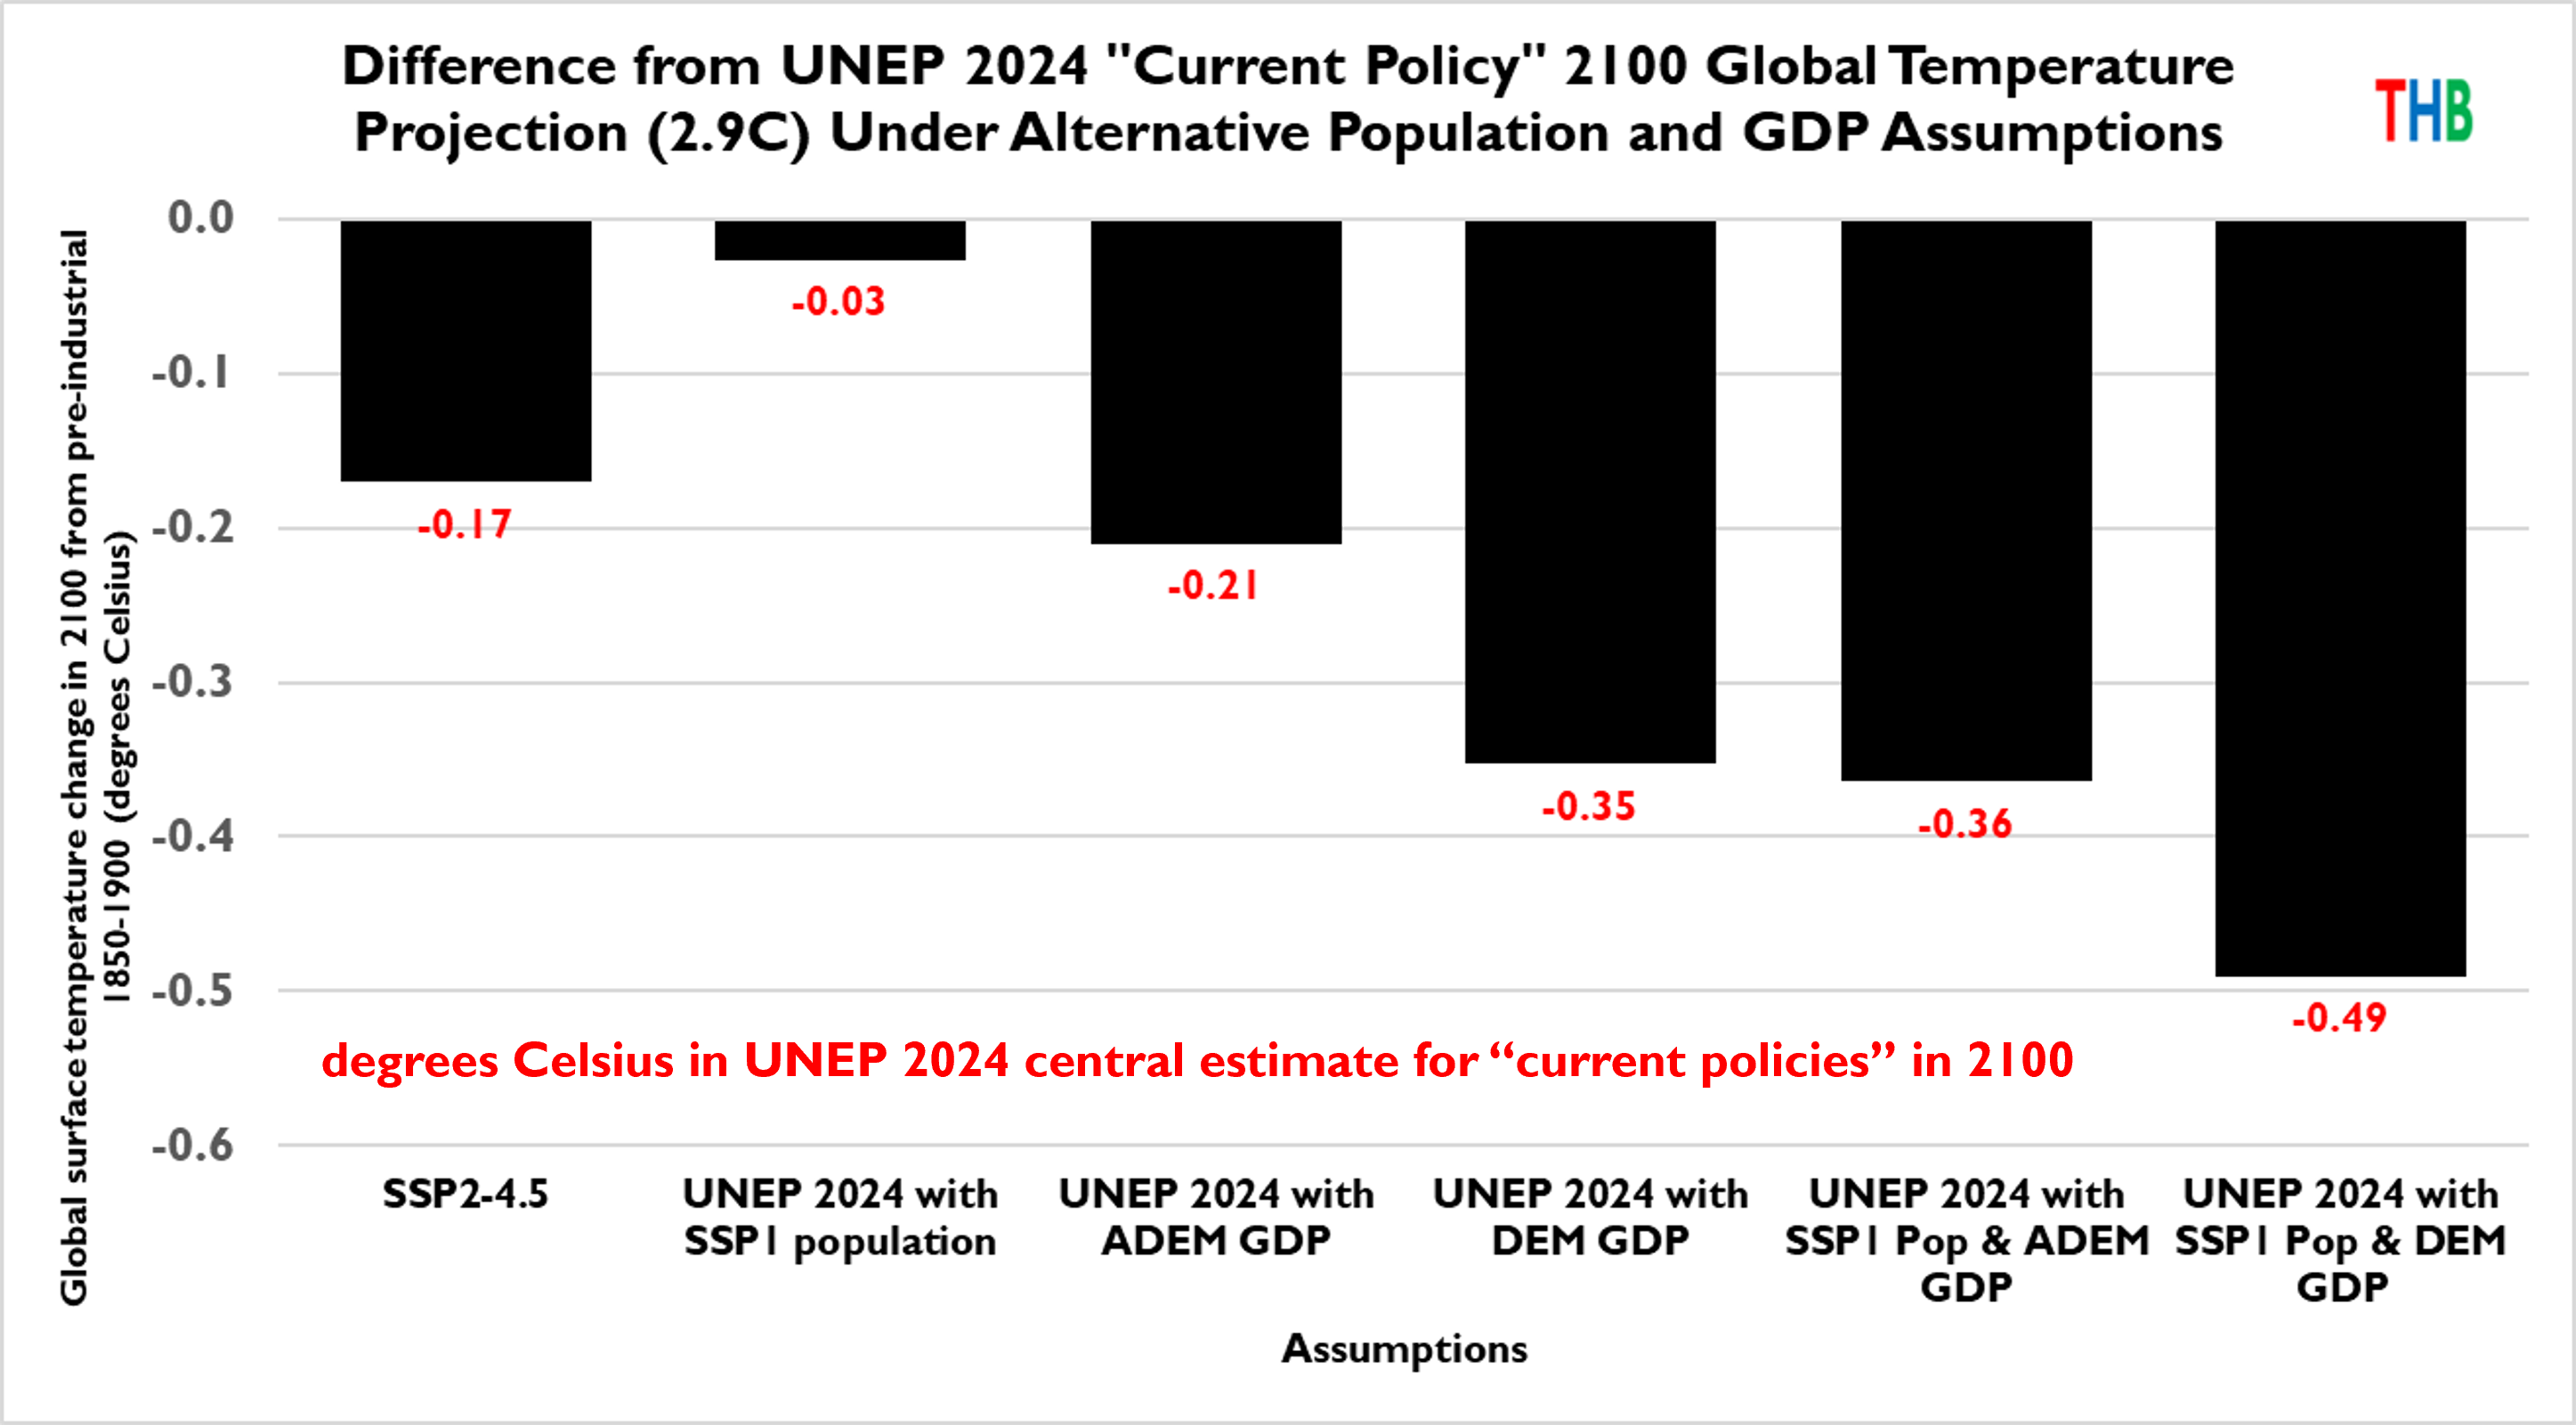
The last term (GHG emissions/GDP) represents how GHG-efficient our economy is. If we hold this efficiency constant, then reducing projected population and GDP per capita, compared to what the UN assumes, means we would also project less GHG emissions and less climate change.
Roger Pielke Jr. explored this idea in an excellent 2024 post on The Honest Broker. He showed that, all else equal, assuming slower GDP per capita and population growth, more consistent with historical trends, brought the UN’s projection of global warming under current policies down from nearly 3 degrees C to just over 2 degrees C (by 2100, above pre-industrial temperatures). In other words, slowing economic and population growth might get us close to the 2-degree Paris Agreement goal under current climate policies.
This may seem like good news, but it probably isn’t. A country’s affluence is strongly correlated with its ability to adapt to climate and climate change, along with a host of other measures of societal well-being. A world with a bit less affluence and climate change is probably worse off than a world with a bit more affluence and climate change, at least up to a certain point. This is one of several reasons why I think adaptation and economic development are vastly underappreciated in climate change research, policy, and public discourse. (I will have a lot more to say on this in the next few days, when my colleagues and I release a new working paper. See my remarks in the video below for a preview of our argument.)
Conclusion
In summary, global economic development has followed several broad patterns quite consistently for over half a century. These patterns simply continuing to hold over the coming decades would in some cases constitute a large departure from development trends that researchers and major international agencies are forecasting and planning around. These development patterns may change, of course, but society should spend more time and attention considering and planning for them to continue. Anything less would be irresponsible, in my view.
Interesting note. A few thoughts:
If I'm not mistaken, the DEM calculations and forecasts put quite a lot of importance in the “bucket” you put a country in.
But what if several low income or lower-middle income countries succeed in pushing just enough to get to sweet spot of being an emerging economy? Then, GDP per capita growth should accelerate, shouldn't it?
My assumption would be that this is a more likely scenario, at least for some countries. Every country that developed successfully reached this threshold at some point - and in different ways - and then growth really accelerated for several decades.
Or am I missing something?
Also, another thought:
You analyzed growth and development since 1980, which just be heavily skewed by China's rise in particular, to a lesser degree perhaps by the other Asian Tigers.
How would these models look for the period from 1945 to 1980 (or 1973)? Though many countries started from an extremely low level, their relative per capita growth was very impressive in that period (and that includes lots of developing countries - again, with the notable exception of China that hurt itself immensely).
Developed countries’ growth was also very fast.
That's not to say we'd see such a growth pattern come back. But it is an interesting contrast showing that the growth patterns of the last couple of decades are not necessarily the only ones that are possible.
great points. to get more growth, need land value tax plus yimby. to reduce inequality, need social wealth funds and capital inflow levies. to go green, need nuclear, which means dereg, which is yimby. plus industrial policy. to get more kids....no magic bullet. universal benefits plus growth plus lvt plus yimby might help?